• Home
  • About
  • Areas We Serve
  • Insights
  • Contact

Boyd Financial Strategies, Inc.

Family-owned investment firm in Auburn, MA since 1983

  • Financial Planning
  • Investment Management
  • Family Office Services

Why Costs Are Up

October 8, 2026 by Peter Boyd

Market Commentary · Q3 2026

Inflation is a real presence in our lives today. The last time we experienced something this dramatic was in the early 1980s. While we have always had a base level of inflation by government (Federal Reserve and Treasury) design, when it changes quickly, we feel it more.

To provide some basic insight, the chart below shows two policy-related inflation drivers: Money Supply (M2) and Money Velocity.
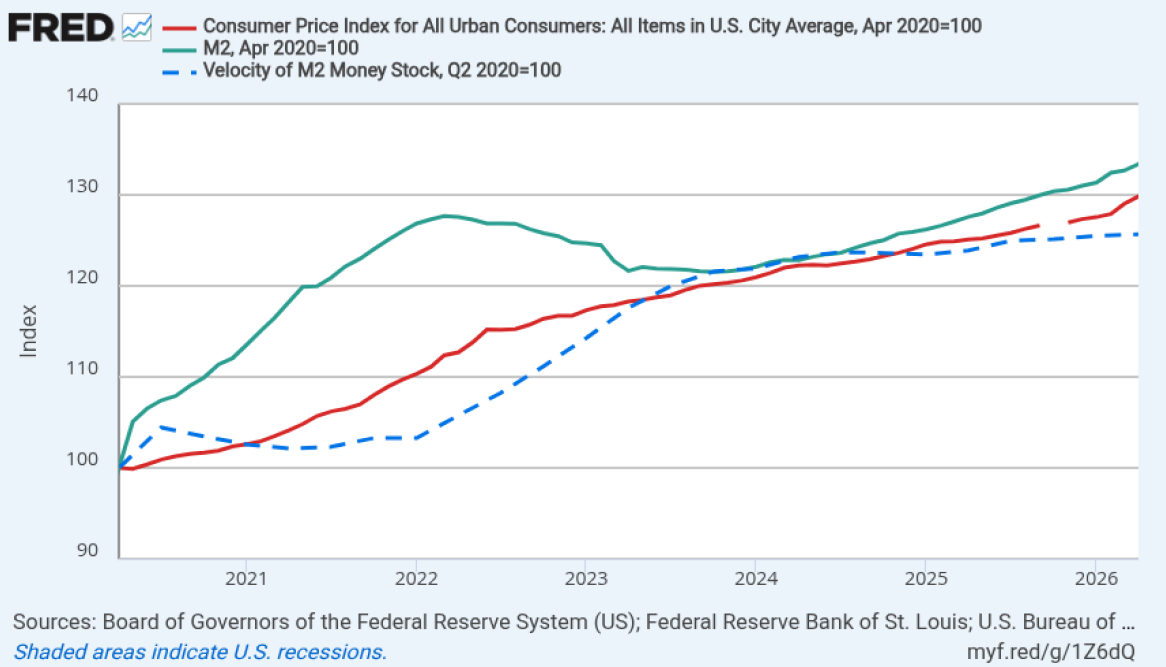
FRED chart of CPI-U, M2 money supply, and M2 velocity indexed to 2020 = 100, from 2020 through 2026
Figure 1 — CPI-U · M2 Money Supply · M2 Velocity (2020 = 100)

The solid Red line is inflation (CPI-U) and was driven up by the response to Covid-19. The solid Green line is the Money Supply, which was increased dramatically with the Federal Government and Fed policies injecting money into the economy. Money Velocity (dashed Blue line) picked up in 2022 and beyond as we started recovering from the Covid shutdowns. Although not shown, crude oil prices spiked over 50% during the 2021–23 period, plus supply chain problems reduced supply. Both of these also drove the inflation increases. By 2024, the Covid period had added about 20% to the cost of goods as measured by the CPI-U — roughly double the base level.

Since the inflation drivers settled down in 2023, inflation has stabilized around 2.7% to 2.9% per year. The recent upward turn is likely due to the short-lived spike in energy costs associated with the Iran War.

What to Expect Now: Even if crude oil prices remain in a reasonable range, the wild card appears to be diesel fuel costs going higher due to the Ukraine–Russia war. This could bend the CPI curve higher next year as transportation costs are reflected in everything we buy. With the increase in inflation and strength in the US economy, interest rates are also increasing, with an impact on investments and borrowing.

As always, each of our clients has different needs. Please contact us with any concerns or questions you may have about how inflation and rising rates affect your investments.

— With regards,
John, Peter & Jack
CFP® · ChFC® · Series 65

Past performance success is not a predictor and cannot guarantee future investment results.
Filed Under: Blog, Market Commentary

It’s About Time

August 25, 2026 by Peter Boyd

Market Commentary · Q2 2026

Investing and the time frame that you are using to view your investments can cause a lot of confusion. A good investment can be great in the long term but a disaster in the short run, and of course, the opposite may be true.

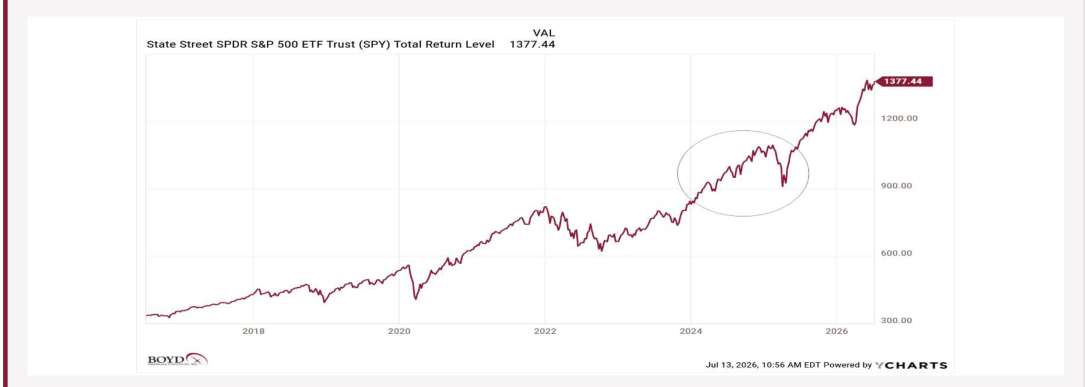
Where are we today in the stock market? Using the SPY ETF (S&P 500 Index) to represent the “stock market”, the chart below shows we are near an all time high and that a pull back from this point would not be unusual. At this point, the price pattern does not indicate a change from the positive growth of recent years.

SPY (S&P 500 ETF) total return level, 10-year weekly chart, near an all-time high with the prior tariff correction circled
Figure 1 — SPY (S&P 500 ETF) · 10-Year Weekly

Event driven corrections are often not predictable and can cause a 1/3 to 1/2 correction of the prior run-up (note circled part of chart showing the Tariff correction). These are called corrections because the fundamental earnings growth and market pricing of the companies making up the market were only threatened on a short-term basis.

So how does “Time” play a role in “Success” or “Failure” of investment performance? If you focus on the monthly performance, you cannot see the overall trend, so the perception of success can vary greatly.

The best time frame to us is the one that is related to your use of the money for purchases requiring a significant amount of money. If you are away from a major purchase in a few months, then the monthly variation can be very significant. If this is retirement money with 10 years or more to go, then the corrections are not meaningful.

If you are planning to draw income, the corrections are of less importance as only a small percentage is being sold during these negative time periods in an overall positive growth period.

— With regards, John, Peter & Jack
CFP® · ChFC® · Series 65

Past performance success is not a predictor and cannot guarantee future investment results.
Filed Under: Blog, Market Commentary

A Time of Uncertainty

June 4, 2026 by Peter Boyd

Market Commentary · Q1 2026

Risk investments, like stocks, hate uncertainty — especially wars. The more boring the news, the better for businesses, allowing them to focus on improving profits, making long-term capital investments, and thereby improving their stock price.

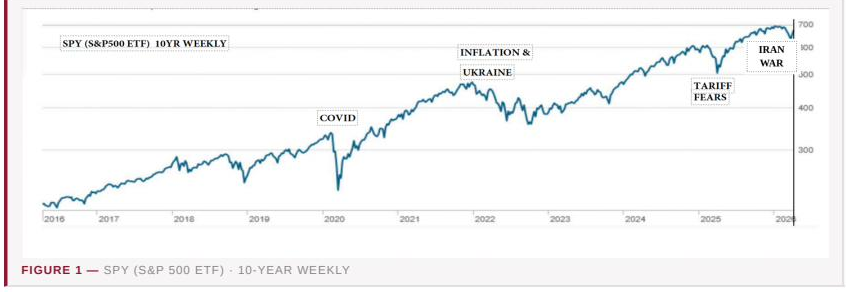
The following chart (SPY ETF) going back 10 years shows that we have had to deal with several bumps in the generally upward moving price chart. It also puts the current small decline due to the Iran War in perspective compared with the event-related selloffs that have happened in the past.

SPY (S&P 500 ETF) 10-year weekly price chart, with prior selloffs around COVID, inflation and Ukraine, tariff fears, and the Iran War marked for context
Figure 1 — SPY (S&P 500 ETF) · 10-Year Weekly

When events like this occur, we make changes in our Managed Mutual Fund portfolios to reduce risk. Most recently we have moved 15% position in SPY into a less volatile fund (FAUG) which also has a 10% downside buffer. Our Gold position has been particularly helpful in cushioning market declines and improving overall returns, and we are maintaining that position during the current period of market fear.

Of course, we cannot predict the future. The current Iran War could be prolonged and oil prices could get out of control. This means that we may have to employ stronger protections to prevent excess declines in the portfolios. This may include deeper buffered vehicles or even money market (cash) positions.

Our basic method of management is to discern shorter term changes in relative strength and make changes in response to what the components of the stock market tell us about the future direction. Of course, each of our clients has different needs and therefore a mix of different investments in cash, fixed income (bonds and annuities) and equities (stocks). Please contact us with any concerns or questions you may have regarding your investments.

— With regards, John, Peter & Jack
CFP® · ChFC® · Series 65

Past performance success is not a predictor and cannot guarantee future investment results.

Filed Under: Blog, Market Commentary

March 2018 Newsletter

March 10, 2019 by Peter Boyd

Download our latest newsletter. Download Now

Filed Under: Blog

December 2018 Newsletter

December 21, 2018 by Peter Boyd

Download our latest newsletter. Download Now

Filed Under: Blog

Bull Market Top

November 2, 2018 by Peter Boyd

Here is a chart of the S&P 500 since the end of the great recession decline of 2008.  The price channel gives the range of possible values for what appears to be a developing market top and decline.  The formation in the circle shows two tries at higher prices and this is often followed by another try which would form a classic head and shoulder’s pattern. 

A rally from the current levels is certainly possible, even likely, but any significant negative events can drive stock prices down to the lower half of the price channel shown.

Keep in mind that stock market prices and trends look out ahead of current economic conditions which are still strong.

Filed Under: Blog

Contact Us

SEC Registered Investment Adviser (CRD #107505)
© 2026 Boyd Financial Strategies, Inc. All rights reserved.  Privacy Policy  |  Disclosures

This website does not provide investment advice and does not represent an offer to buy or a solicitation to sell any security. Boyd Financial Strategies, Inc. is registered with the U.S. Securities and Exchange Commission as a Registered Investment Adviser. The firm conducts business and offers advisory services only in states where it is registered or notice-filed, or where it qualifies for an applicable exemption.

MENU
  • Home
  • About
  • Financial Planning
  • Investment Management
  • Family Office Services
  • Insights
  • Areas We Serve
  • Contact