Market Commentary · Q3 2026
Inflation is a real presence in our lives today. The last time we experienced something this dramatic was in the early 1980s. While we have always had a base level of inflation by government (Federal Reserve and Treasury) design, when it changes quickly, we feel it more.
To provide some basic insight, the chart below shows two policy-related inflation drivers: Money Supply (M2) and Money Velocity.
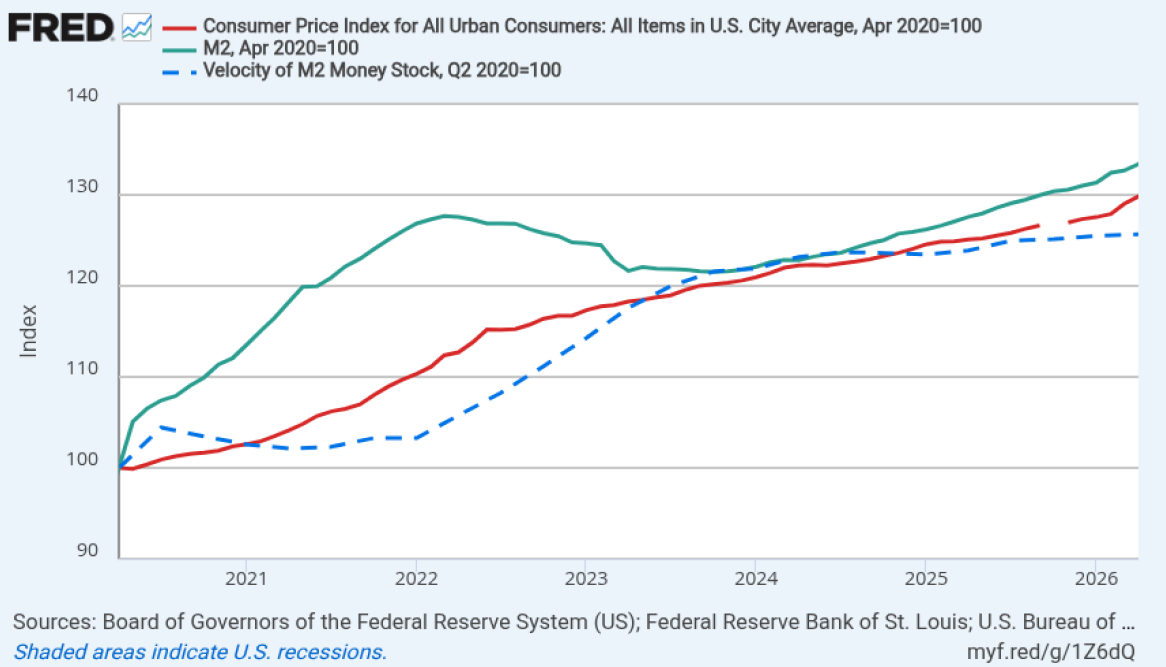
The solid Red line is inflation (CPI-U) and was driven up by the response to Covid-19. The solid Green line is the Money Supply, which was increased dramatically with the Federal Government and Fed policies injecting money into the economy. Money Velocity (dashed Blue line) picked up in 2022 and beyond as we started recovering from the Covid shutdowns. Although not shown, crude oil prices spiked over 50% during the 2021–23 period, plus supply chain problems reduced supply. Both of these also drove the inflation increases. By 2024, the Covid period had added about 20% to the cost of goods as measured by the CPI-U — roughly double the base level.
Since the inflation drivers settled down in 2023, inflation has stabilized around 2.7% to 2.9% per year. The recent upward turn is likely due to the short-lived spike in energy costs associated with the Iran War.
What to Expect Now: Even if crude oil prices remain in a reasonable range, the wild card appears to be diesel fuel costs going higher due to the Ukraine–Russia war. This could bend the CPI curve higher next year as transportation costs are reflected in everything we buy. With the increase in inflation and strength in the US economy, interest rates are also increasing, with an impact on investments and borrowing.
As always, each of our clients has different needs. Please contact us with any concerns or questions you may have about how inflation and rising rates affect your investments.
— With regards,
John, Peter & Jack
CFP® · ChFC® · Series 65
Past performance success is not a predictor and cannot guarantee future investment results.